Fluentdがコンテナサービスのログコレクタとしてほぼデファクトスタンダードになりつつあります。 一方で、Fluentdの監視方法についてはまだまだ多様なやり方があるようにも思います。
その中でも最近人気になりつつあるPrometheusを使った監視の設定も下記のドキュメントに掲載されています。 Monitoring Fluentd (Prometheus) | Fluentd

Prometheusの特徴としてはPull型のモニタリング方式となっており、上記で利用されているfluent-plugin-prometheusでも fluentdの内部メトリクスを取るためにfluentdからPullできる仕組みを提供するものとなっています。
fluent-plugin-prometheusを使う以外にも、PrometheusではOS自体のメトリクスや既存のソフトウェアのメトリクスを取得したい場合はexporterと呼ばれる仕組みがあります。 サーバに導入することで、Prometheus サーバが読み取り可能なデータを生成します。Exporterの一覧は
から参照可能です。
Fluentdのexporterもサードパーティでいくつか作られています。
- https://github.com/V3ckt0r/fluentd_exporter
- https://github.com/matsumana/td-agent_exporter
- https://github.com/wyukawa/fluentd_exporter
- https://github.com/be-hase/fluentd_monitor_agent_exporter
現状のexporterではfluent-plugin-prometheusよりも取得できる情報は限られています。 今後、Fluentd公式でも準備されると良さそうな機構ですね。
今回は[fluent-plugin-prometheus](https://github.com/fluent/fluent-plugin-prometheus]を利用してモニタリングするところまでを実施します。
Prometheusのセットアップ
Getting started | Prometheusを参照して、Using pre-compiled binariesの方法でセットアップ。
Prometheusのバイナリのダウンロード
$ wget https://github.com/prometheus/prometheus/releases/download/v2.1.0/prometheus-2.1.0.linux-amd64.tar.gz
$ tar xvfz prometheus-*.tar.gz
$ cd prometheus-*
2 - prometheus.ymlを編集する
デフォルトのymlは下記です。
# my global config
global:
  scrape_interval:     15s # Set the scrape interval to every 15 seconds. Default is every 1 minute.
  evaluation_interval: 15s # Evaluate rules every 15 seconds. The default is every 1 minute.
  # scrape_timeout is set to the global default (10s).

# Alertmanager configuration
alerting:
  alertmanagers:
  - static_configs:
    - targets:
      # - alertmanager:9093

# Load rules once and periodically evaluate them according to the global 'evaluation_interval'.
rule_files:
  # - "first_rules.yml"
  # - "second_rules.yml"

# A scrape configuration containing exactly one endpoint to scrape:
# Here it's Prometheus itself.
scrape_configs:
  # The job name is added as a label `job=<job_name>` to any timeseries scraped from this config.
  - job_name: 'prometheus'

    # metrics_path defaults to '/metrics'
    # scheme defaults to 'http'.

    static_configs:
      - targets: ['localhost:9090']
Fluentdのノードを監視対象に追加する場合の方法として、手動でscrape_configsのstatic_configsを追加する方法が一番簡単。 PrometheusでFluentdのメトリクスを取得するためには、Prometheusのscrape_configsにFluentdのサーバを追加する必要があります。
scrape_configs:
  - job_name: 'fluentd'

    static_configs:
      - targets: ['fluentd-server:24231']
3 - Prometheusを起動する
下記でフォアグラウンドで起動できます。
./prometheus --config.file="prometheus.yml"
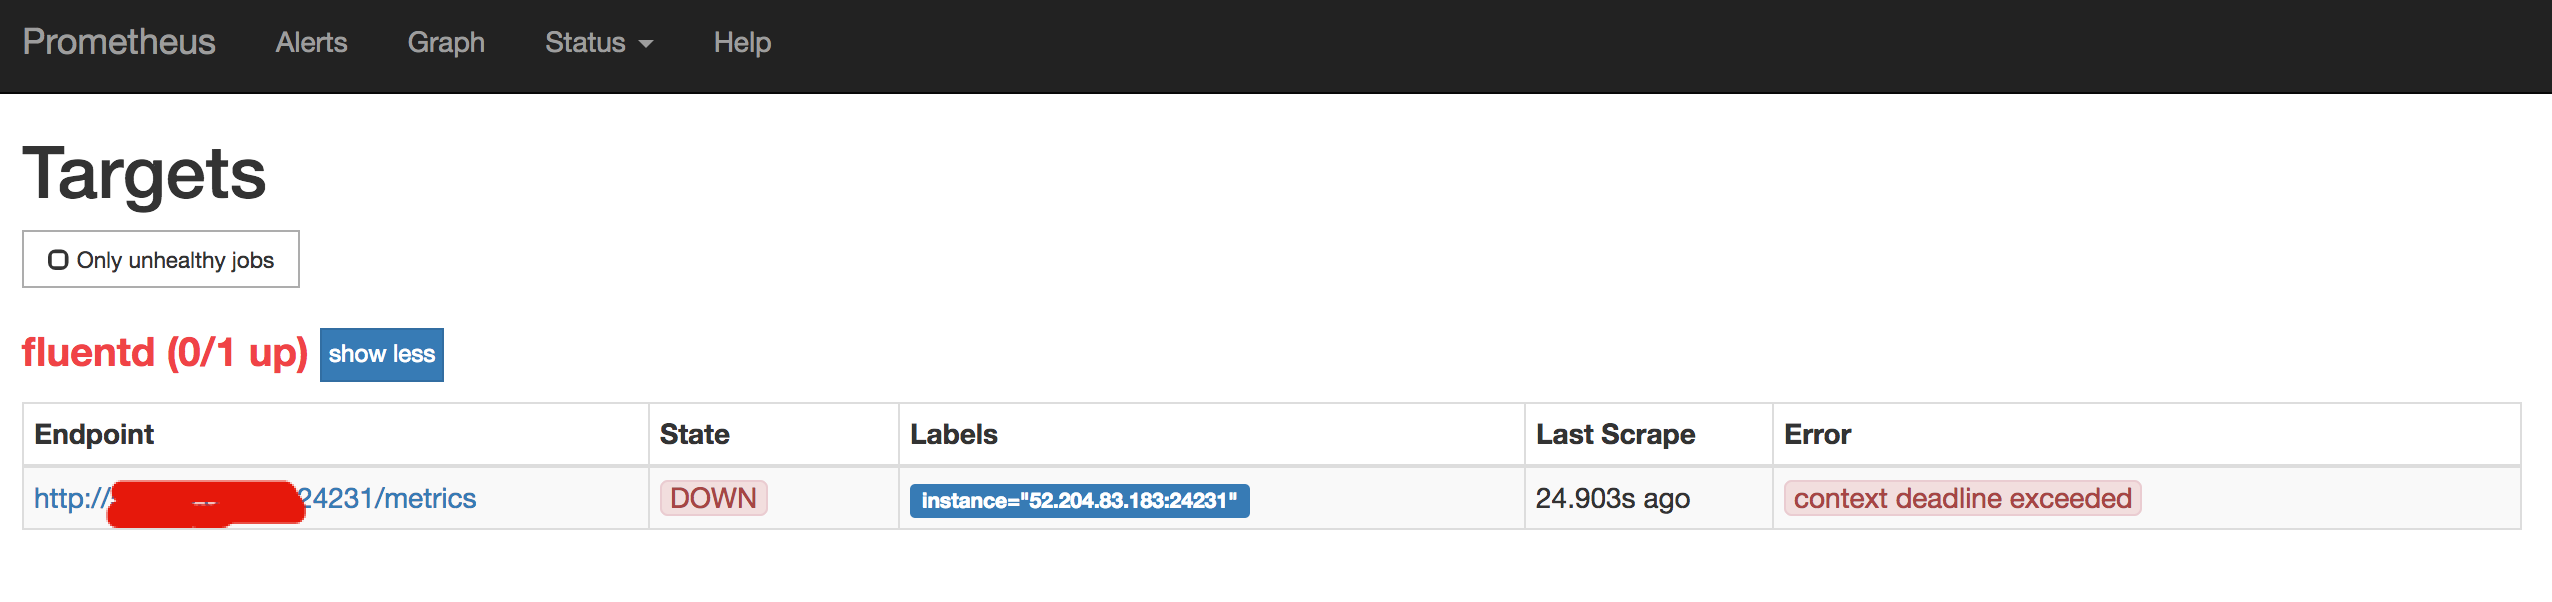
起動後にhttp://xxxxx:9090/にてPrometheusにアクセス可能です。 起動後にTargetsを見ると、scrape_configsに登録したサーバがリストにあることがわかります。 まだfluentdのサーバの準備ができていないので、stateがDOWNです。
fluent-plugin-prometheusのセットアップ
fluent-plugin-prometheusのセットアップ時の注意点として、v1ではfluentd v0.14/v1.0(td-agent3)をサポートしており、v0ではfluentd v0.12(td-agent2)をサポートしています。 そのため、インストール時にはバージョン指定を忘れないようしてください。
td-agent3を利用する場合
今回は、Amazon Linuxなので、下記コマンドで。
$ curl -L https://toolbelt.treasuredata.com/sh/install-amazon2-td-agent3.sh | sh
次に下記でfluent-plugin-prometheusをインストールします。td-agent3なので、バージョン指定せずに最新版をいれるようにしています。
が、
$ td-agent-gem install fluent-plugin-prometheus
/opt/td-agent/embedded/bin/ruby: /lib64/libc.so.6: version `GLIBC_2.25' not found (required by /opt/td-agent/embedded/lib/libruby.so.2.4)
というエラーが発生する感じに。
$ ldd --version
ldd (GNU libc) 2.17
glibc 2.17がインストールされているようで・・・
glibcをビルドしたりとか色々試した結果、そもそもAmazon Linux 1の2017.09を利用していることが原因でした・・・・
2017.12からAmazon Linux 2、それよりも前はAmazon Linux 1なので下記のコマンドでインストールしましょう。
$ curl -L https://toolbelt.treasuredata.com/sh/install-amazon1-td-agent3.sh | sh
$ td-agent-gem install fluent-plugin-prometheus
そんなしょうもないことで時間を無駄にしたので、prometheusの詳細はまた今度にして、とりあえずメモがてら公開。 ちゃんとドキュメントは読もうね! Installing Fluentd Using rpm Package | Fluentd